
Inverter size and battery capacity: what we learnt from our first case study
Before we recommend a system to any customer, we want to be confident that the savings estimates we publish are grounded in reality. Payback calculators are only as useful as the assumptions behind them — and the two assumptions that matter most are: how effectively can a 3.6kW inverter shift your electricity usage onto off-peak rates, and how much battery capacity does a typical household need?
Rather than rely on manufacturer specifications or theoretical modelling, we set out to answer both questions experimentally, in a real house, with real data. This post explains what we tested, how we tested it, and what approximately three months of live data showed us.
Headline savings
The pilot programme house saved approximately £243 in the first 90 days. That’s over £80 per month or ~£2.70 per day without any lifestyle changes required. Read on for details of what else we found or skip to the end to see a detailed breakdown of how we calculated this saving.
The test setup
The pilot house is a four-bedroom early-1900s semi-detached in Sheffield, occupied by a family with gas-fired central heating. It's a deliberately representative choice — this type of property makes up a significant proportion of UK housing stock, and with gas heating the electricity demand profile is straightforward: cooking, lighting, laundry, and appliances in regular use. Annual electricity consumption is relatively high at approximately 4,500kWh.
The household switched to a time-of-use tariff on 29 November, at which point arbitrage began — so all savings figures presented here run from that date. The tariff provides a five-hour off-peak window at a significantly lower rate than the peak daytime rate, which is the foundation of the load-shifting strategy.
We were testing two specific questions simultaneously:
Question 1 — Inverter performance: Does our G98-compliant 3.6kW inverter actually achieve the 80% load-shifting figure we use in our payback calculator?
Question 2 — Battery sizing: For a household with occasional high-usage days exceeding 15kWh, does a 30kWh (two-battery-pack) system meaningfully outperform a 15kWh (single-battery-pack) system — or does the off-peak charging window become the real constraint before battery capacity does?
The system ran as a two-pack 30kWh configuration from 29 November through to 3 February 2026, at which point we switched to a single 15kWh pack to directly measure any difference in load-shifting performance.
A practical note on the data: this is a genuine working pilot, not a controlled laboratory. As we built toward a production monitoring setup, there were two database transitions — the cleanest continuous dataset runs from 7 January 2026 onwards, and that's where the charts below are drawn from. The headline savings figures cover the full period from 29 November and are calculated consistently throughout, described in detail at the end of this post.
What does a typical day with an EquiVolt system look like?
You might have seen a daily use curve, like the schematic on our how it works page, or if you look at your daily usage from your smart meter. However, the detailed pilot data has given us useful insights into how well a 3.6kW inverter can match the instantaneous loads from appliances such as kettles, ovens and toasters. The image below shows the main power flows over the course of a typical day in the pilot house.
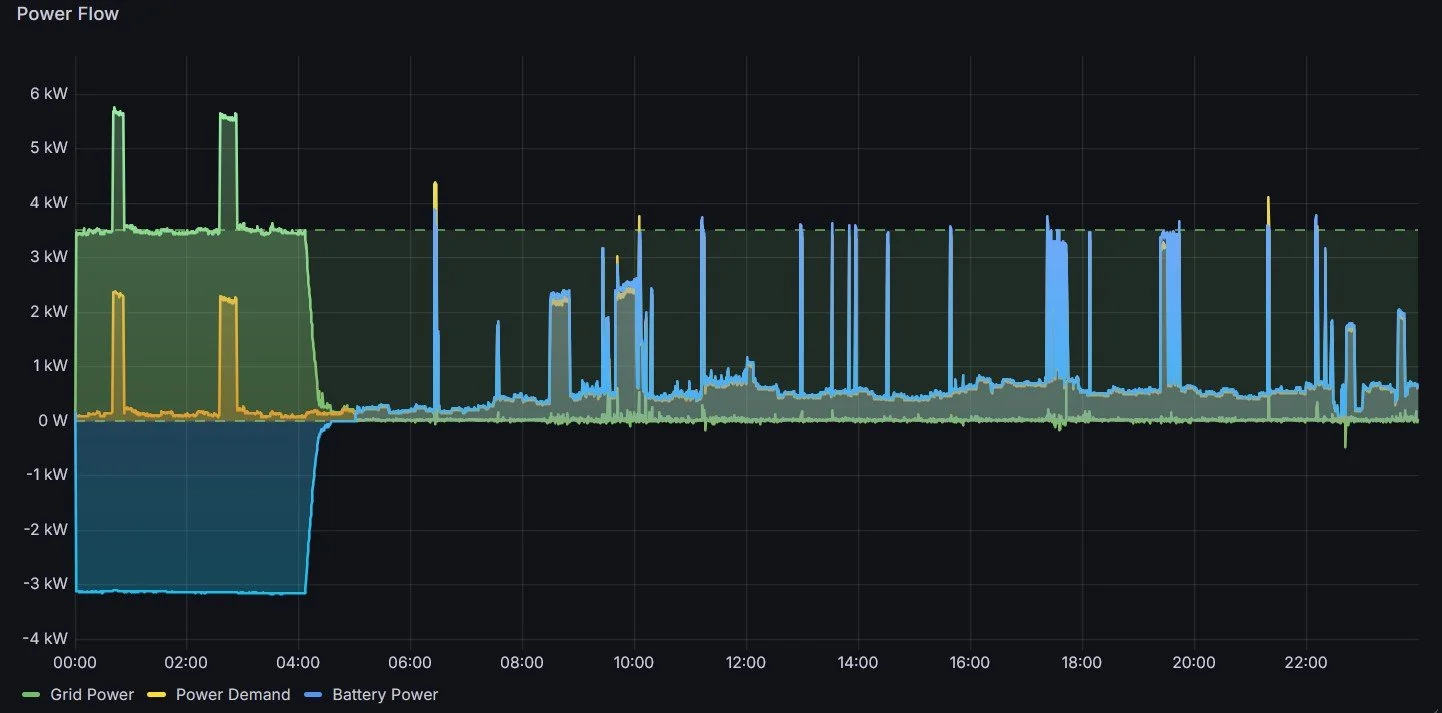
Power flows measured across one day in February 2026. Power drawn from the grid shown in green, load usage in yellow and battery power in blue. An interactive snapshot across a full week of power flow data can be found here.
You can see that during the off-peak window, 00:00-05:00, the battery charges up and any household loads draw directly from the grid. However, once the peak rate starts at 05:00 the household load is almost exactly balanced by the power delivered by the battery, meaning the grid usage drops to a negligible amount. Another aspect of real usage data is the shape: load usage doesn’t follow a smooth curve, it has sharp peaks when high-power appliances are turned on. These sharp peaks in usage were yet another reason to test the reality of load shifting with a 3.6kW inverter.
Is 3.6kW of inverter power enough to shift load into off-peak hours?
This is the question that most directly determines whether your real-world savings will match an estimate. If the inverter can't charge the battery fast enough during the off-peak window, or if the load regularly exceeds the output of the inverter, the financial case weakens. We wanted to test how much of the household load was possible to shift into effectively off-peak usage using the battery system.
The 80% load-shifting figure we chose in our online calculator was a deliberately conservative assumption. Before testing, we didn't know precisely where real performance would land.
What the data showed:
The system has achieved ~93% off-peak load-shifting, both before and after switching to a single pack.
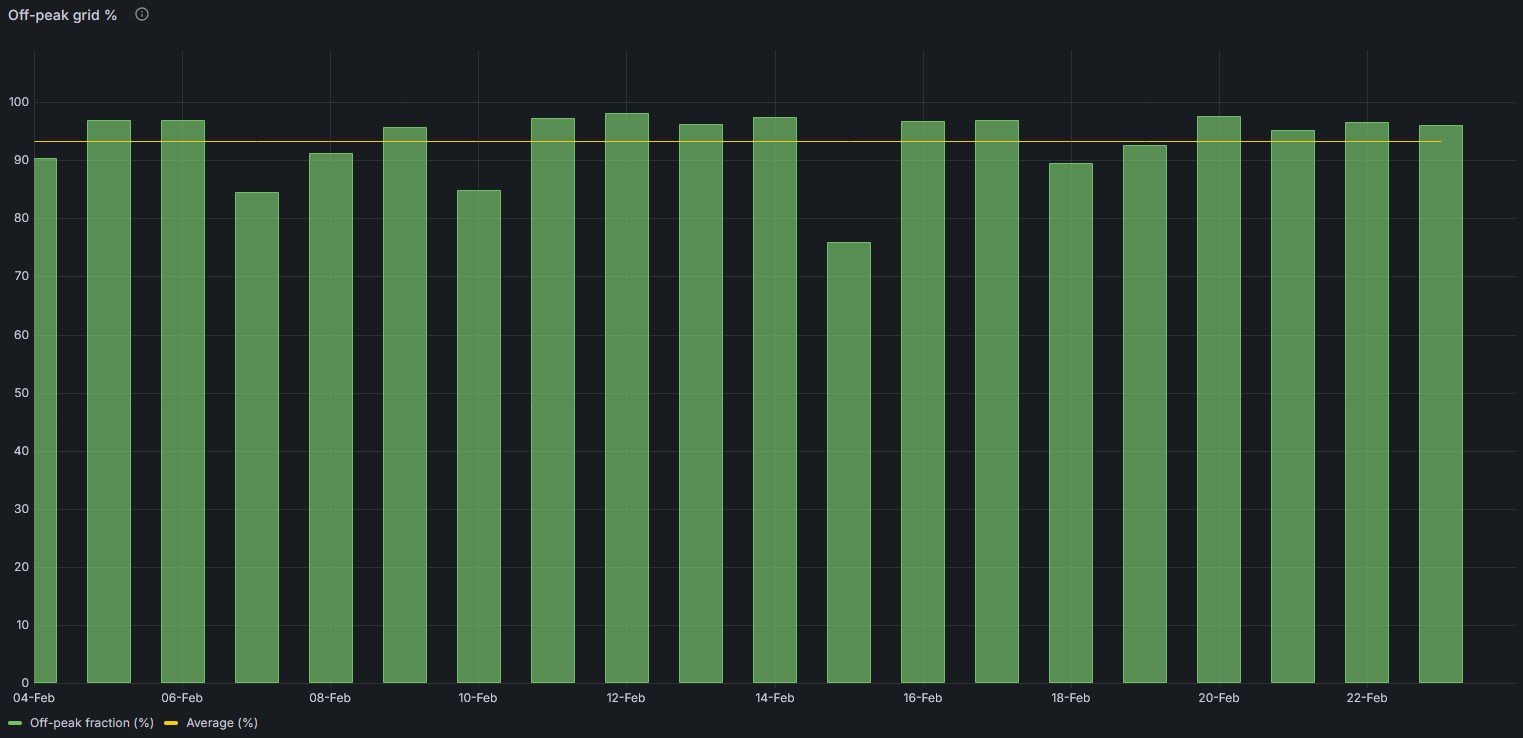
Typical daily load-shifting fraction: how much of the total imported grid electricity was at off-peak rates. An interactive snapshot of this data is available here.
What does 93% mean in practice? For every 100kWh of electricity this household used, roughly 93kWh was supplied by the battery or directly used in off-peak hours and only 7kWh came directly from the grid at peak rates. The peak rate usage comes from occasional brief demand spikes that exceed inverter output and infrequent high-usage days when the battery is depleted before the end of the peak period.
What this means for your payback estimate:
Our calculator uses 80% as its baseline load-shifting assumption. Real-world data showing 93% means our estimates are conservative — customers should in practice expect savings that modestly exceed the calculator output, all else being equal.
It's worth noting that load-shifting performance will vary between households depending on usage patterns, tariff window length, and overnight consumption behaviour. 93% is this household's result; it may be somewhat higher or lower for yours. But the 80% baseline in our calculator is designed to be comfortably achievable rather than aspirational.
Should I choose a 15kWh or 30kWh system?
The initial 30kWh installation was a deliberate experimental choice, not a default recommendation. Two hypotheses motivated it: first, that a household with occasional high-usage days might benefit from extra capacity overhead to ensure more complete load-shifting; second, that running a two-pack system would let us observe battery balancing behaviour across packs under real operating conditions.
But there's a fundamental constraint worth understanding before concluding that bigger is always better: the off-peak charging window, not battery capacity, is often the limit.
A standard five-hour off-peak window, at the real-world average charge rate of approximately 3.2kW achieved by this system, allows a maximum of approximately 16kWh of charging per night, regardless of how much battery capacity is installed. Note that 3.68kW is the maximum permitted inverter power under G98 compliance — the actual average charge rate achieved in practice is typically lower. This means a 15kWh battery and a five-hour off-peak window are almost perfectly matched: the window fills the battery, the battery covers the day. A second, balanced, 15kWh pack would make the whole system underutilised, with only 50% of it’s total capacity in regular use.
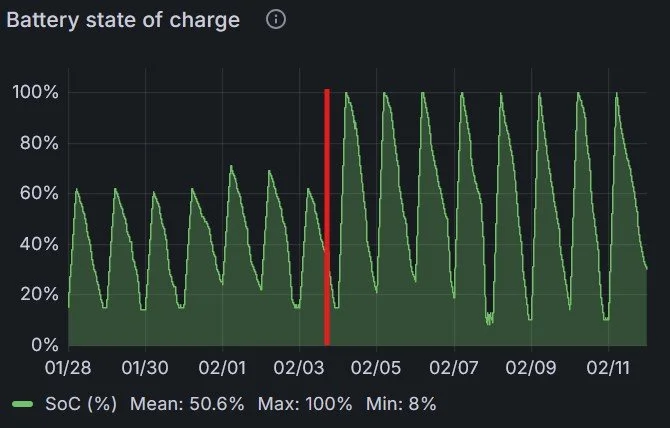
The State of Charge (SoC) before and after the switch to a single 15kWh battery pack. The transition is shown with the red vertical line.
What the data showed:
The load-shifting percentage during the single-pack 15kWh phase averaged approximately 93% — identical to the performance recorded when using a 30kWh double-pack setup. A second pack didn't improve performance in terms of load-shifting or savings, because battery capacity was never the constraint. The five-hour charging window was. You can see the State of Charge (SoC) for the battery system just before and after the switch in the chart above. The key takeaway is that when two packs were installed only a fraction of the total usable capacity was utilised. However, after switching to one-pack the vast majority of the battery capacity is being used every day, which is better for a fast payback time.
When does a 30kWh system make sense?
The two-pack system becomes genuinely advantageous in two scenarios. The first is if the customer can access a tariff with longer off-peak windows, e.g. 6 or 7 hours. Then they would be able to charge beyond the 16kWh limit seen here and exploit a bigger system. The second is where a household has a repeating pattern of usage where high-usage days regularly come after one or two low-usage days. The low-usage days would allow the batteries to charge up gradually over a few nights and then provide a larger capacity for the high-usage day that follows.
For most households on a standard five-hour off-peak window with typical daily consumption, 15kWh is the right system — and this data supports that recommendation.
What savings has the pilot household achieved?
Over 90 days of operation — 29 November 2025 to 26 February 2026 — the pilot household has saved £243 through electricity arbitrage. This covers some of the heaviest consumption months of the year: December and January.
That works out to an average of approximately £2.70 per day over this period. The household consumed around 1,800kWh during these 90 days, which is ~40% of their estimated annual consumption of 4,500kWh — a disproportionately high share, reflecting higher winter usage driven by shorter daylight hours, more time spent indoors, and greater use of appliances like the oven and tumble dryer.
Projecting forward:
The remainder of the year will see slightly lower monthly savings as consumption drops. Applying the same 93% load-shifting and the implied tariff differential from the real data to an estimated 2,700kWh of remaining annual consumption gives a projected saving of approximately £475 for the rest of the year — for a projected annual total of ~£700.
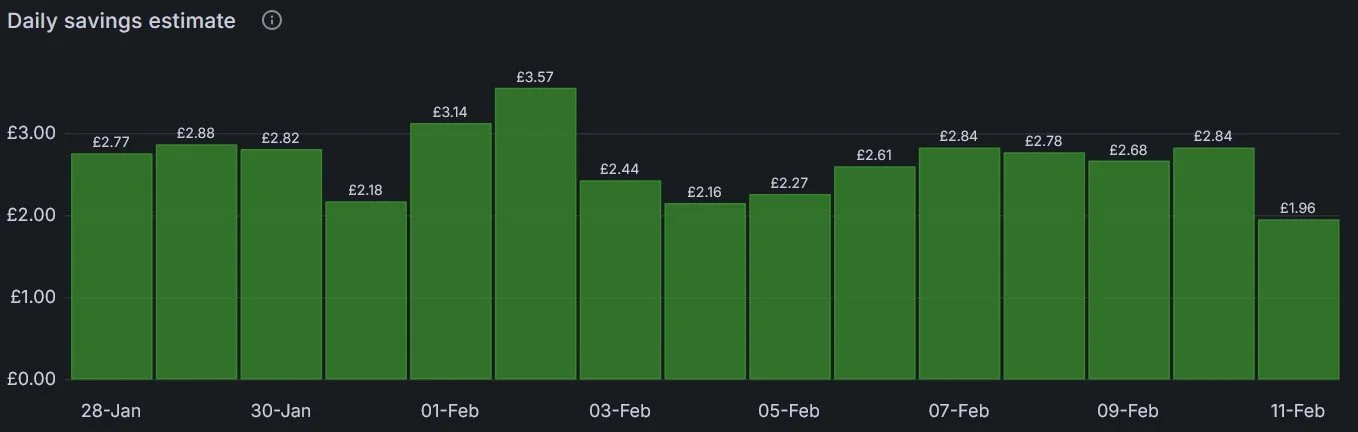
Typical daily savings estimates based on the additional fraction of energy shifted into off-peak rates.
What these figures don't include:
The savings calculation is deliberately conservative. It compares the cost of powering the home without a battery system against the actual cost of grid electricity drawn with the system running using the same time-of-use tariff. Standing charges are excluded as they're equivalent either way.
This method naturally captures any round-trip efficiency losses because the household load usage and grid import are explicitly calculated rather than relying on an estimated efficiency factor. Secondly, and more meaningfully, households switching from a flat-rate tariff to a time-of-use tariff also save money on any electricity they consume directly during the off-peak window — overnight usage of appliances like dishwashers, for example. This secondary saving isn't counted in the £243 figure, which means the real benefit to the household is modestly higher still.
What we're looking at next
The post-switch dataset on the single 15kWh pack currently covers just over three weeks — enough to report a clear directional finding, but not enough to draw conclusions about seasonal variation. As spring and summer patterns emerge, we'll be watching whether the load-shifting percentage holds, how cycling depth changes with lower overall consumption, and whether there are edge cases worth reporting. We'll publish another report, with a fuller dataset, later in the year.
How we calculated the savings
For transparency, here's exactly how the arbitrage saving is calculated. We compare two costs for the same period:
Reference cost (without EquiVolt): Total household load electricity consumption multiplied by the relevant tariff rate for each hour — peak usage at the peak rate, any overnight usage at the off-peak rate. This is what the household would have paid on the same tariff without a battery system.
EquiVolt cost: Total electricity drawn from the grid — which includes both battery charging and direct household usage — multiplied by the relevant rate. The battery draws more from the grid than it delivers to the home and these round-trip losses are captured by this calculation.
The difference between these two figures is the estimated saving. Standing charges are identical in both scenarios and excluded.
Reference cost estimate, without battery system:
| Load usage (kWh) | Rate (£/kWh) | Cost (inc VAT) | |
|---|---|---|---|
| Peak | 1270 | 0.2928 | £371.86 |
| Off-peak | 247 | 0.0660 | £16.27 |
| Total | 1517 | £388.13 |
Estimated real costs, with battery system:
| Grid usage (kWh) | Rate (£/kWh) | Cost (inc VAT) | |
|---|---|---|---|
| Peak | 127 | 0.2928 | £37.04 |
| Off-peak | 1634 | 0.0660 | £107.84 |
| Total | 1761 | £144.88 |
Therefore, the savings estimate for these 90 days = £388.13 - £144.88 = £243.25
All data is from a live EquiVolt installation running since November 2025. Savings figures are estimated from battery system data and actual tariff rates. Projected annual savings are estimates based on observed performance and expected seasonal variation — your results will depend on your usage profile, tariff, and household behaviour.
Want to find out more?
Interested in what a battery storage system could save your household? Try our savings calculator.
Not sure if a battery system is right for you? Get in touch or book a free, no-obligation, call with one of the team to discuss the options and get honest advice.