
Solar, battery or both? A comparison for UK homes
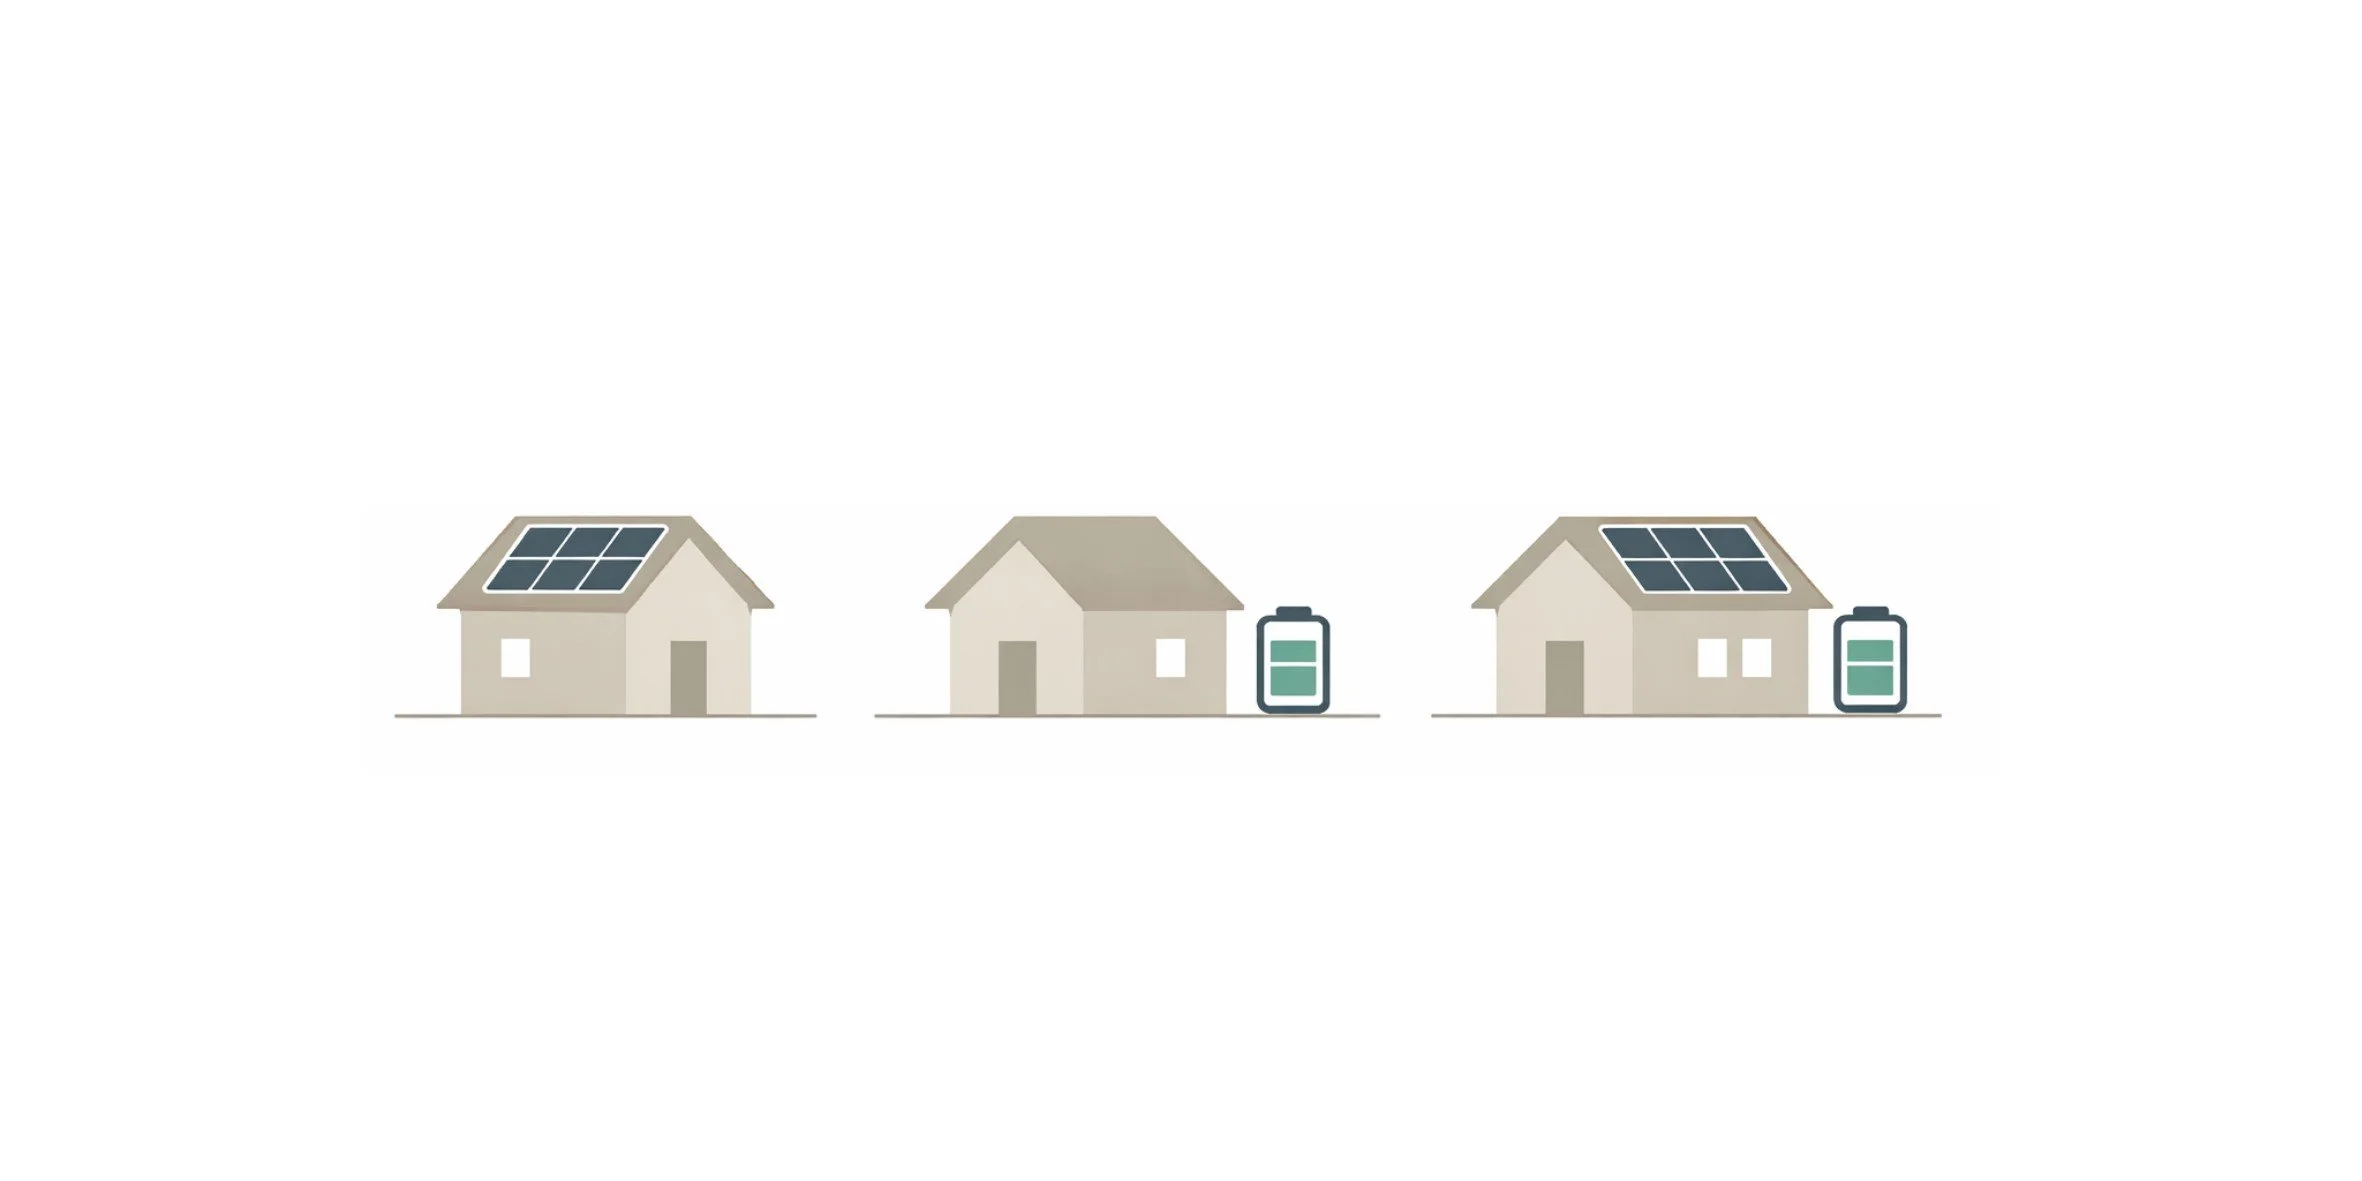
When most people think about home energy storage, they picture solar panels on a roof with a battery stored in the garage. It's become the default image of home energy independence. But here's a question worth asking: what system makes sense for you?
There isn’t a single best option for everyone. Depending on your circumstances, a standalone battery system might make more financial sense than solar, or you might benefit most from combining both. This article breaks down the costs, savings, and payback periods for each option so you can make an informed decision for your home. We’ve worked through the numbers with an example household using ~10 kWh per day. The detailed breakdown is shown at the end so you can check our working and estimate your own savings for the different options.
How each option works
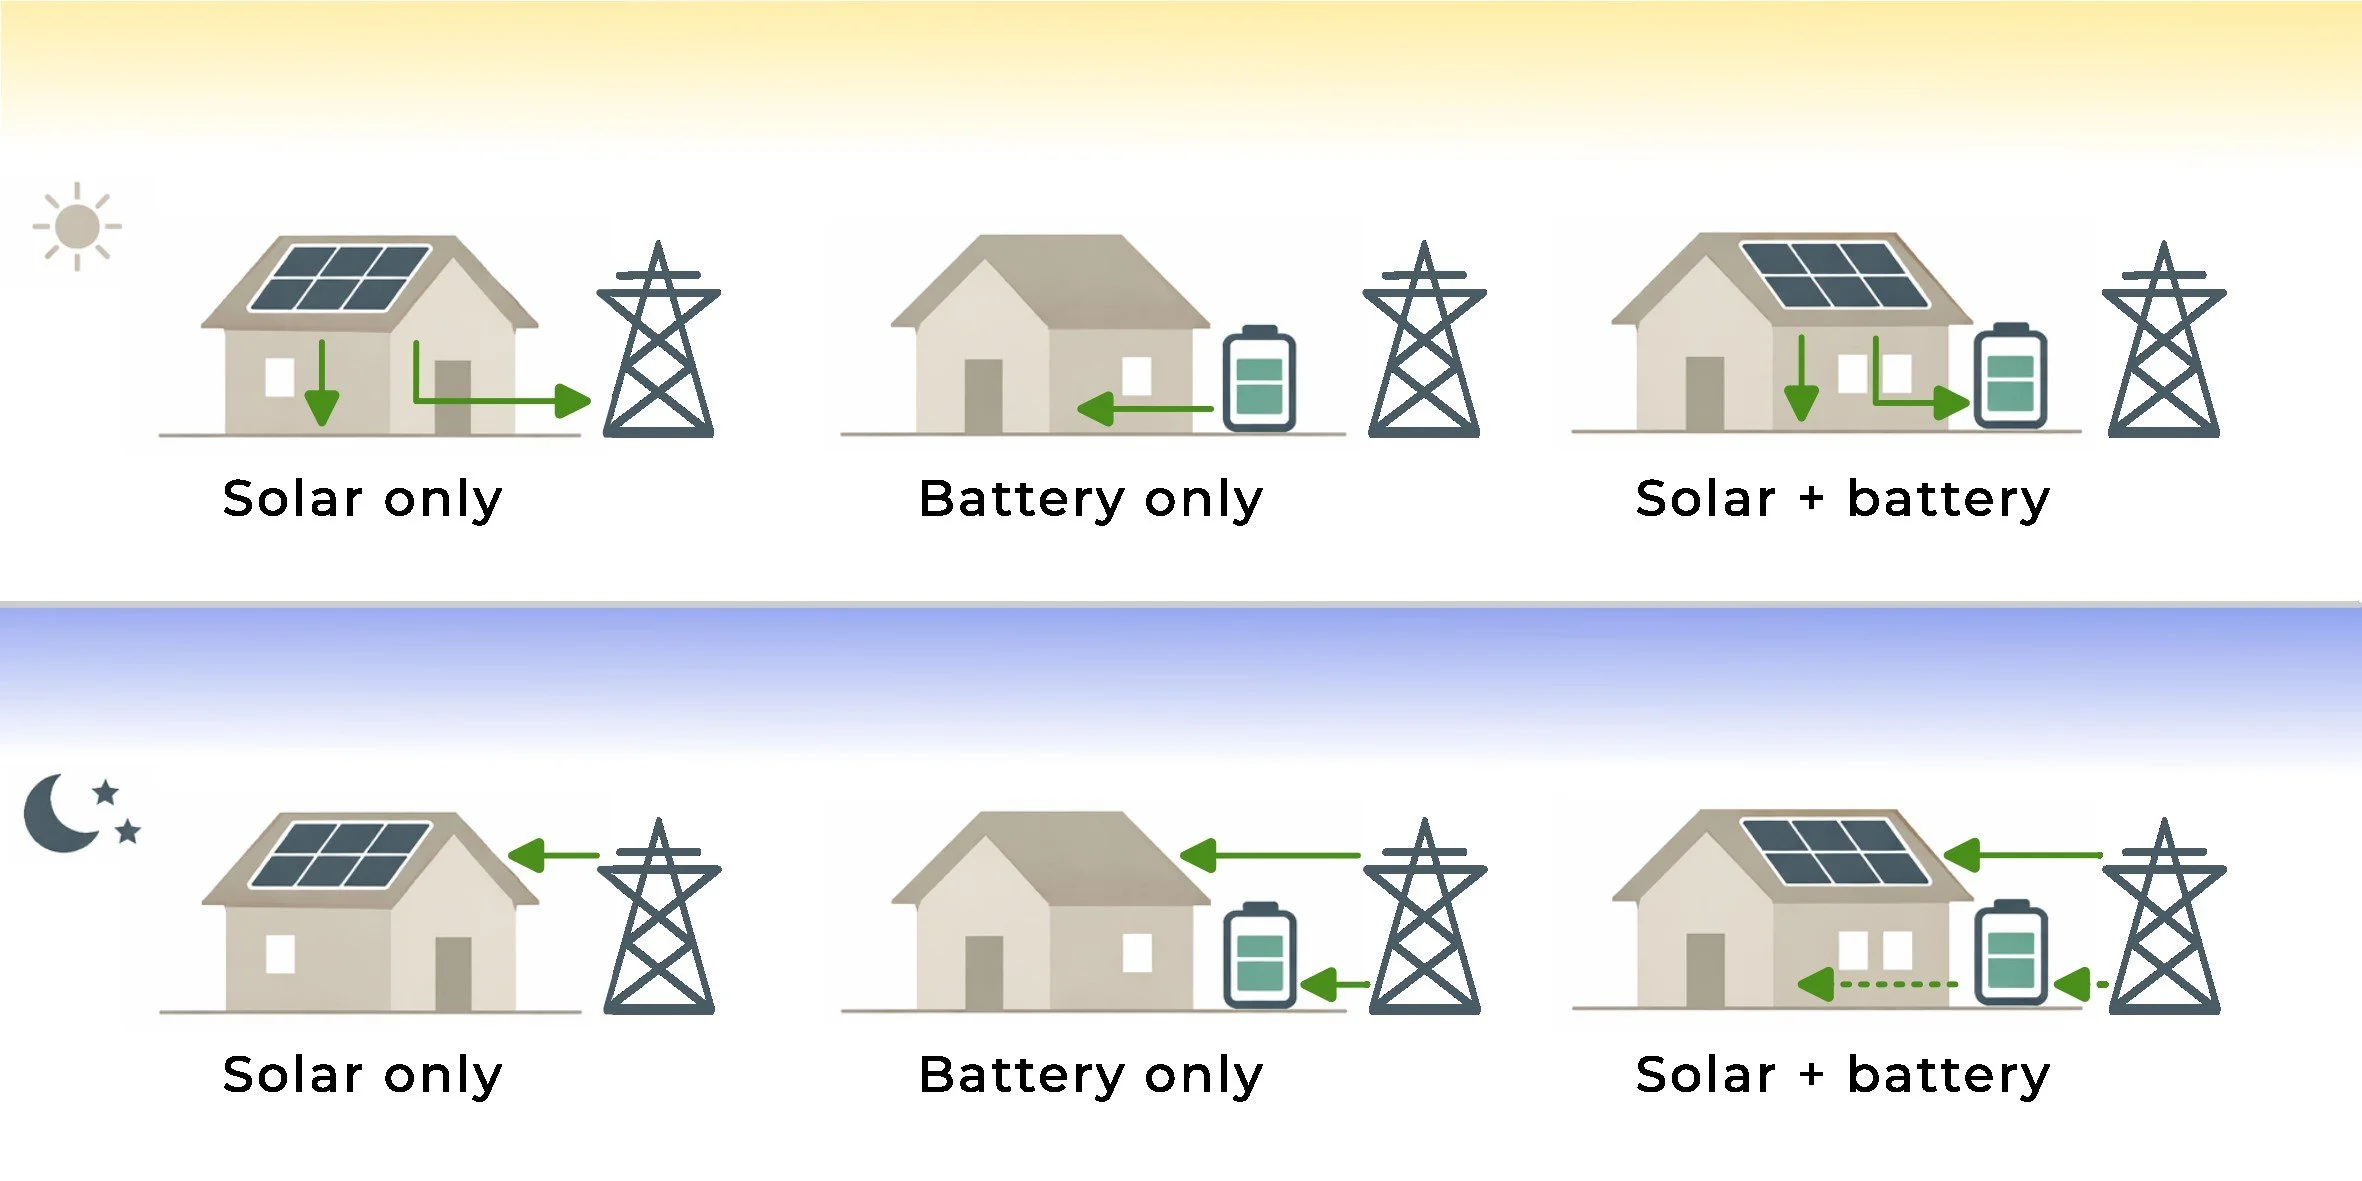
Solar panels only generate electricity from sunlight during the day. You use what you can while it's being generated, and any excess gets exported to the grid, usually for a small payment. The challenge? Solar generation peaks around midday when many households use the least electricity, and produces nothing after dark when you're cooking dinner and watching TV. In northern England, a typical 4kW system generates around 3,000-3,800 kWh per year - but with significant seasonal variation. Summer days might produce 20+ kWh; winter days might manage 2-3 kWh.
A standalone battery takes a completely different approach. Instead of generating electricity, it stores cheap overnight electricity from the grid and releases it during expensive peak hours. If you're on a time-of-use tariff (where electricity costs less overnight), you're essentially buying low and using high. This works consistently year-round.
Solar combined with a battery gives you the best of both worlds: store your free solar generation for use in the evening, and top up from cheap grid electricity overnight when needed. It's the most capable setup, but also the most expensive and complex.
The costs
Let's look at typical prices for each option:
| Option | Typical Cost | What You Get |
|---|---|---|
| Solar only | ~£7,500 | 10 panels (~4kW system) |
| Solar + 5kWh battery | ~£8,900 | 10 panels + battery |
| Solar + 10kWh battery | ~£12,200 | 10 panels + larger battery |
| Battery only (15kWh, EquiVolt system) | ~£3,000 | Standalone battery system |
Prices shown are indicative for January 2026. Actual costs vary by supplier and installation requirements.
Why is battery-only so much cheaper? No scaffolding, no roof work, no panels, simpler and faster installation. A standalone battery can typically be installed in half a day; a full solar+battery system might take 2-4 days.
Savings and payback: the numbers
We've calculated realistic annual savings and payback periods for a household using 10 kWh per day (3,650 kWh/year) in northern England. Full calculation details are available at the end of this article.
Key assumptions:
Flat-rate electricity: 27.7p/kWh (for non-battery households)
Time-of-use tariff: 8.5p/kWh off-peak, 29.5p/kWh peak (for battery households)
Solar export rate: 15p/kWh
Battery system total efficiency: 85%
North of England solar yield: ~3,600 kWh/year for a 4kW system
Note: Standing charges apply equally to all scenarios, so we've excluded them from comparisons. All prices are based on January 2026 tariffs.
Results
Solar Only
Annual benefit: £622
Upfront cost: £7,500
Simple payback: ~12 years
Without a battery, you'll use about 18% of what you generate directly (when you happen to be home using electricity while the sun shines). The rest gets exported for 15p/kWh.
Solar + Battery (basic setup)
Annual benefit: £764
Upfront cost: £8,900
Simple payback: ~12 years
Adding a battery increases self-consumption to around 49% - you're storing daytime solar for evening use. But without optimising for time-of-use tariffs, the payback is similar to solar-only.
Solar + Battery (with arbitrage)
Annual benefit: £1,079
Upfront cost: £12,200
Simple payback: ~11 years
This is where solar+battery shines. By switching to a time-of-use tariff and charging the battery overnight when solar doesn't cover your needs, savings increase significantly. This requires more sophisticated system management - your battery needs to charge from cheap grid electricity overnight, not just from solar. To shift more of your energy on to off-peak rates the battery capacity might need to be higher too. The total savings are higher but because of the additional investment payback is similar.
Battery Only
Annual benefit: £610
Upfront cost: £2,999
Simple payback: ~5 years
No solar generation - just charging up on cheap overnight electricity and using it during expensive peak hours. The annual saving is lower than solar+battery, but the much lower upfront cost means faster payback.
Note: Some time-of-use tariffs also allow you to export stored electricity back to the grid during peak hours for additional income. We haven't included this in the calculations, but it's worth exploring.
Which option suits you?
A standalone battery might be right if you:
Are already on (or willing to switch to) a time-of-use tariff
Have an unsuitable roof: north-facing, heavily shaded, or a listed building
Want faster payback with lower upfront investment
Already have an EV or are considering one, this gives you access to competitive time-of-use tariffs
May move house within 10 years
Want to start smaller and potentially add solar later
Solar, with or without a battery, might be right if you:
Have a south-facing, unshaded roof
Own your home and plan to stay long-term
Want to generate your own renewable energy
Can afford the higher upfront investment
Value energy independence and reducing grid reliance
Conclusion
There's no single "best" answer. For many households already on time-of-use tariffs (for example, those with an EV) battery-only offers the fastest payback with the lowest financial risk. However, solar remains an excellent choice for those with suitable roof conditions who value generation alongside storage, and are comfortable with a longer return on investment.
And importantly, choosing battery-only or solar-only now doesn't close any doors. Solar panels and batteries can always be added to existing systems later.
Calculation details
Base assumptions
| Parameter | Value | Notes |
|---|---|---|
| Household usage | 10 kWh/day | Typical med/large UK household |
| Location | North of England | |
| Solar system | 10 panels (~4kW) | |
| Solar yield | ~3,600 kWh/year | ~900 kWh/kWp for North England |
| Flat rate tariff | 27.7p/kWh | Jan 2026 |
| TOU off-peak rate | 8.5p/kWh | 5 hours overnight |
| TOU peak rate | 29.5p/kWh | All other times |
| Export rate | 15p/kWh | Fixed export tariff |
| Battery efficiency | 85% | Round-trip efficiency |
| Battery utilisation | 95% | % of peak usage shifted to battery |
| Self-consumption (no battery) | 18% | MCS standard |
| Self-consumption (with battery) | 49% | MCS standard |
Notes: Standing charges excluded as they apply equally to all scenarios. Simple payback calculated, assuming fixed electricity prices. Payback times will be faster if electricity prices rise.
Baseline: no Solar, no battery (flat rate)
Annual electricity cost = 3,650 kWh × £0.277 = £1,011/year
Scenario 1: solar only
Solar generated:           3,600 kWh/year
Self-consumed (18%):       3,600 × 0.18 = 648 kWh
Exported:                  3,600 - 648 = 2,952 kWh

Value of self-consumed:    648 kWh × £0.277 = £179
Export income:             2,952 kWh × £0.15 = £443
                                              -----
Total annual benefit:                         £622

Upfront cost:              £7,500
Simple payback:            £7,500 ÷ £622 = 12.1 years
Scenario 2: solar + battery (basic, flat rate import)
Solar generated:           3,600 kWh/year
Self-consumed (49%):       3,600 × 0.49 = 1,764 kWh
Exported:                  3,600 - 1,764 = 1,836 kWh

Value of self-consumed:    1,764 kWh × £0.277 = £489
Export income:             1,836 kWh × £0.15  = £275
                                               -----
Total annual benefit:                          £764

Upfront cost:              £8,900
Simple payback:            £8,900 ÷ £764 = 11.6 years
Scenario 3: solar + battery (with grid arbitrage, TOU tariff)
This scenario assumes the battery charges overnight from cheap grid electricity when solar generation is insufficient.
Solar generated:           3,600 kWh/year
Self-consumed (49%):       1,764 kWh (effectively free)
Exported:                  1,836 kWh
Remaining demand:          3,650 - 1,764 = 1,886 kWh

Of that remaining demand:
  Via battery (95%):       1,886 × 0.95 = 1,792 kWh
  Direct from grid (5%):   1,886 × 0.05 = 94 kWh

Battery charging needed (accounting for 85% efficiency):
                           1,792 ÷ 0.85 =  2,108 kWh at off-peak rates

Annual costs:
  Off-peak charging:       2,108 kWh × £0.085 = £179
  Peak grid usage:         94 kWh × £0.295    = £28
  Less export income:      1,836 kWh × £0.15  = -£275
                                               -----
  Net annual electricity cost:                 -£68 (i.e. net credit)

Compared to baseline (£1,011):
Total annual benefit:      £1,011 - (-£68) = £1,079

Upfront cost:              £12,200
Simple payback:            £12,200 ÷ £1,079 = 11.3 years
Scenario 4: Battery Only (15kWh System, TOU Tariff)
Daily usage:               10 kWh

Battery supplies (95%):    10 × 0.95 = 9.5 kWh/day
Direct from grid (5%):     10 × 0.05 = 0.5 kWh/day

Battery charging needed (accounting for 85% efficiency):
                           9.5 ÷ 0.85 = 11.2 kWh at off-peak rates

Daily costs:
  Off-peak charging:       11.2 kWh × £0.085 = £0.95
  Peak grid usage:         0.5 kWh × £0.295  = £0.15
                                            ------
  Total daily:                              £1.10

Annual electricity cost:   £1.10 × 365 = £401

Compared to baseline (£1,011):
Total annual benefit:      £1,011 - £401 = £610

Upfront cost:              £2,999
Simple payback:            £2,999 ÷ £610 = 4.9 years
Want to learn more?
If you're curious about whether a standalone battery could work for your home, try our savings calculator to see personalised estimates based on your actual usage. Or read more about how EquiVolt systems work and whether they're right for you.