
Flexibility is the future
For two decades, British energy policy has tried to build more clean generation. Subsidies, auctions and planning reform all pointed at that target and it has been reasonably successful: wind and solar now supply a substantial share of the country's electricity.
That success has been good news for pollution, air quality, CO2 emissions and increasing energy independence. However, it adds a new challenge: what to do when renewable supply doesn't meet electricity demand.
Fossil fuel plants can be told when to run, wind and solar cannot. They generate when the weather allows, which doesn't normally align with when demand is highest. Closing the flexibility gap between when clean electricity is available and when it is needed has become the central challenge of the UK grid.
This article covers what the gap costs us today, what a full year of real half-hourly prices and grid carbon data shows about it, and how the way households are paid for exporting and using electricity is changing as a result.
What a lack of flexibility costs us today
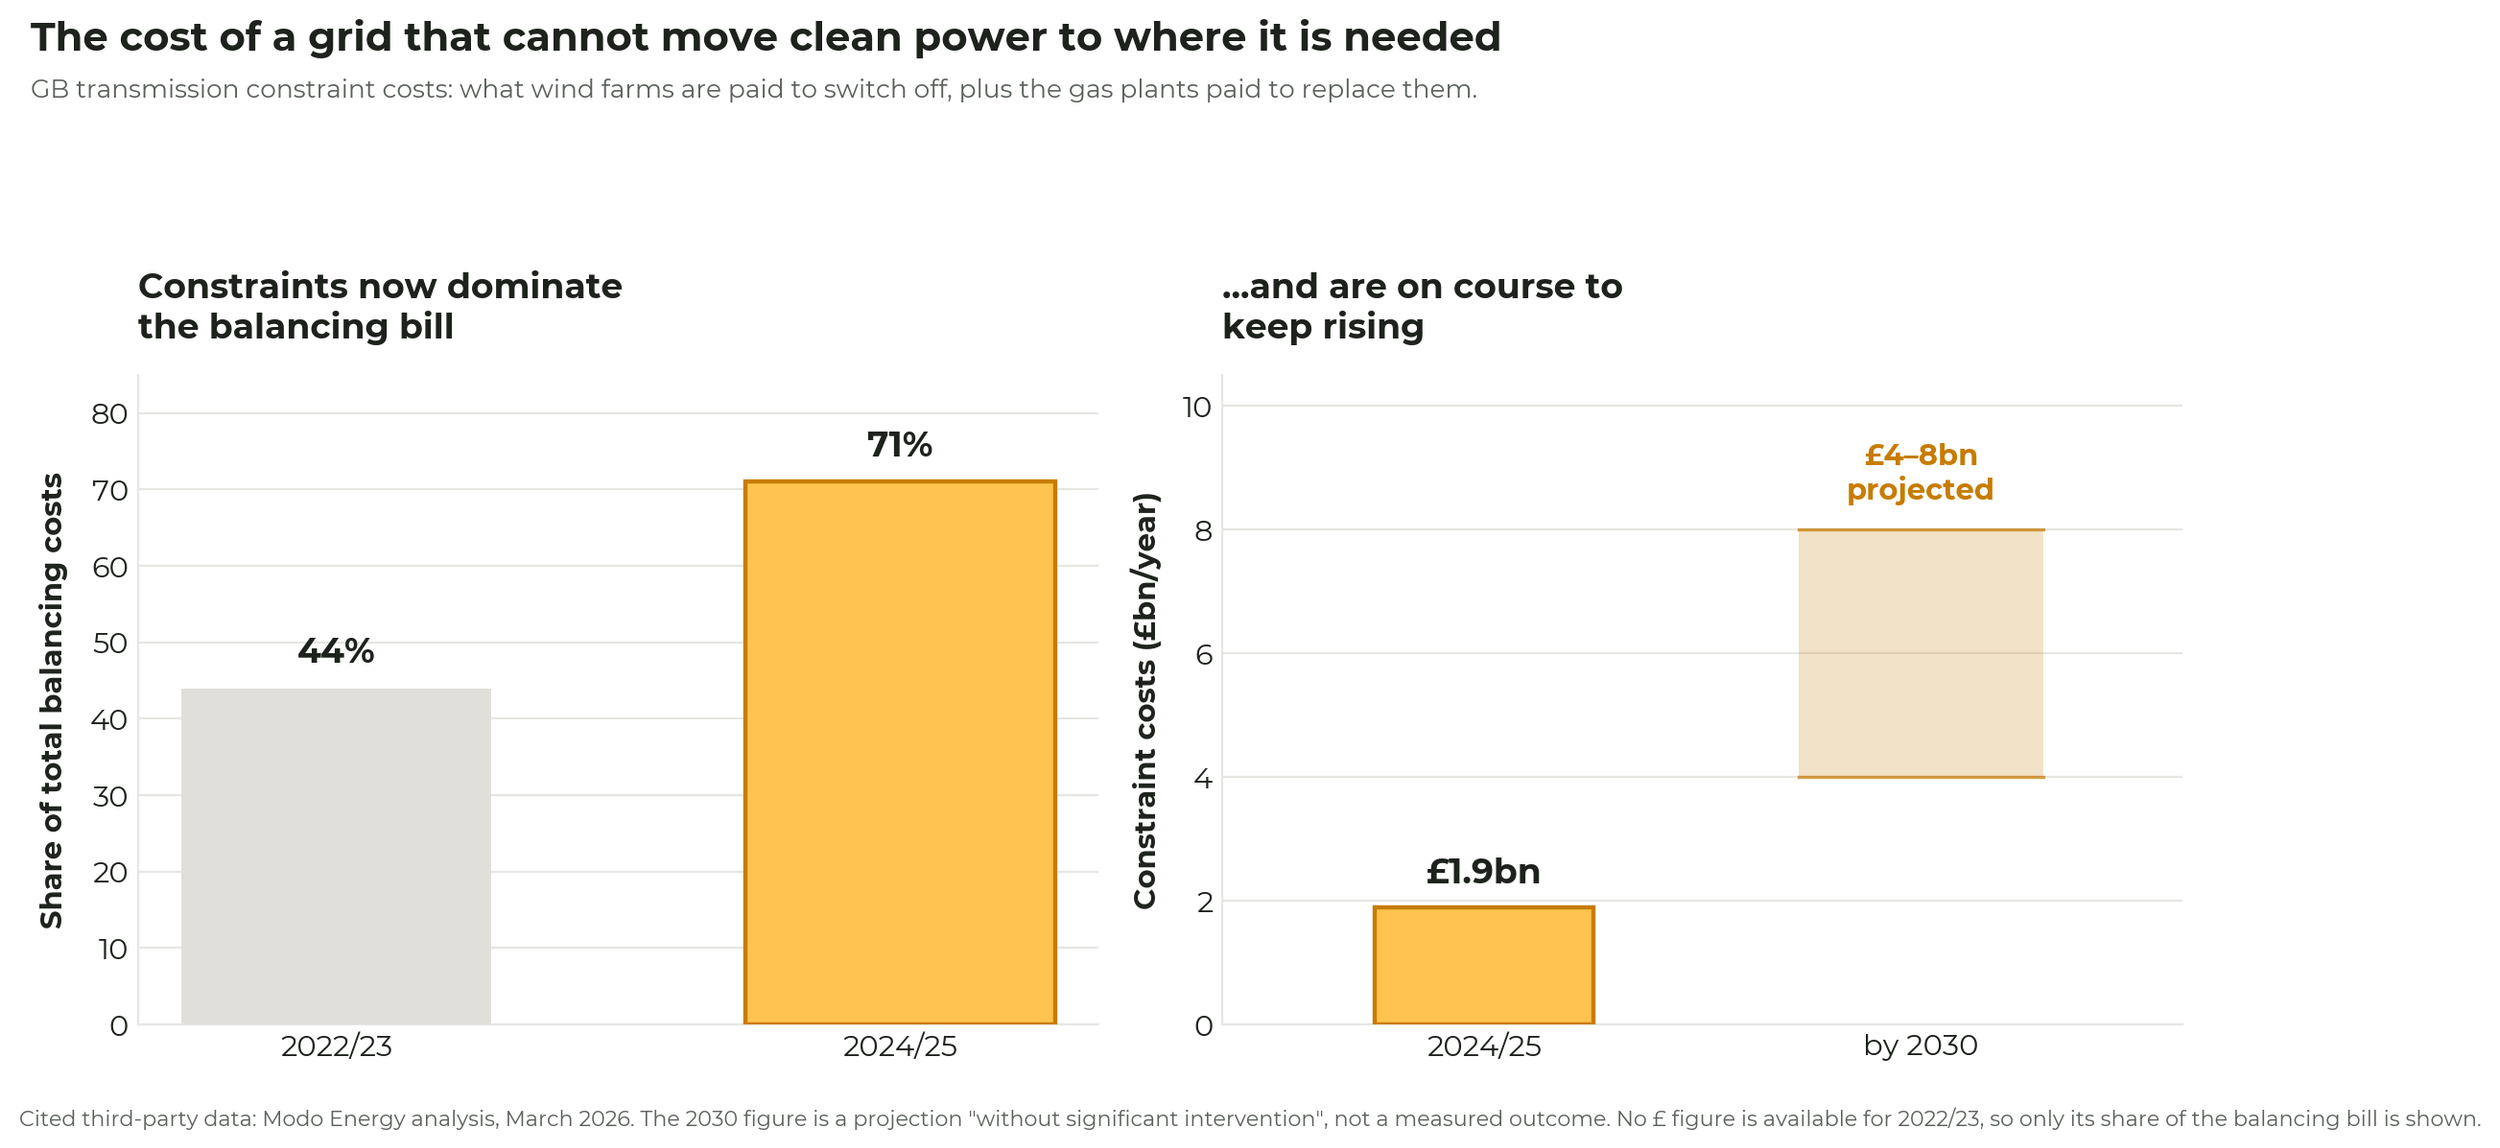
The most visible symptom is curtailment, the term for renewable generation that is available but deliberately not used. When Scottish wind farms produce more power than the transmission network can carry south, the National Energy System Operator (NESO) pays them to stop. It then pays gas plants further south to make up the shortfall and consumers cover both bills.
Transmission constraint costs reached £1.9 billion in 2024/25. That was 71% of Great Britain's total balancing bill, up from 44% in 2022/23. Analysis published by Modo Energy in March 2026 suggests that without significant intervention these costs could reach £4 to £8 billion a year by 2030.
There is a second symptom, when supply exceeds what the system can absorb, wholesale prices can fall below zero. Generators pay to offload power rather than shut down.
A year of real prices in the north-east
To see how often this happens, we analysed a full year of half-hourly Octopus Agile rates for the north-east, covering 1 January to 31 December 2025. Agile passes wholesale prices through to households with only a regional adjustment and a peak uplift, so it gives a reasonably direct view of what electricity cost at any given moment. It is also one of the few tariffs that passes through some of the wholesale market volatility direct to customers. The regional adjustment on the import rate is small, which matters later when we compare these prices against national carbon data.
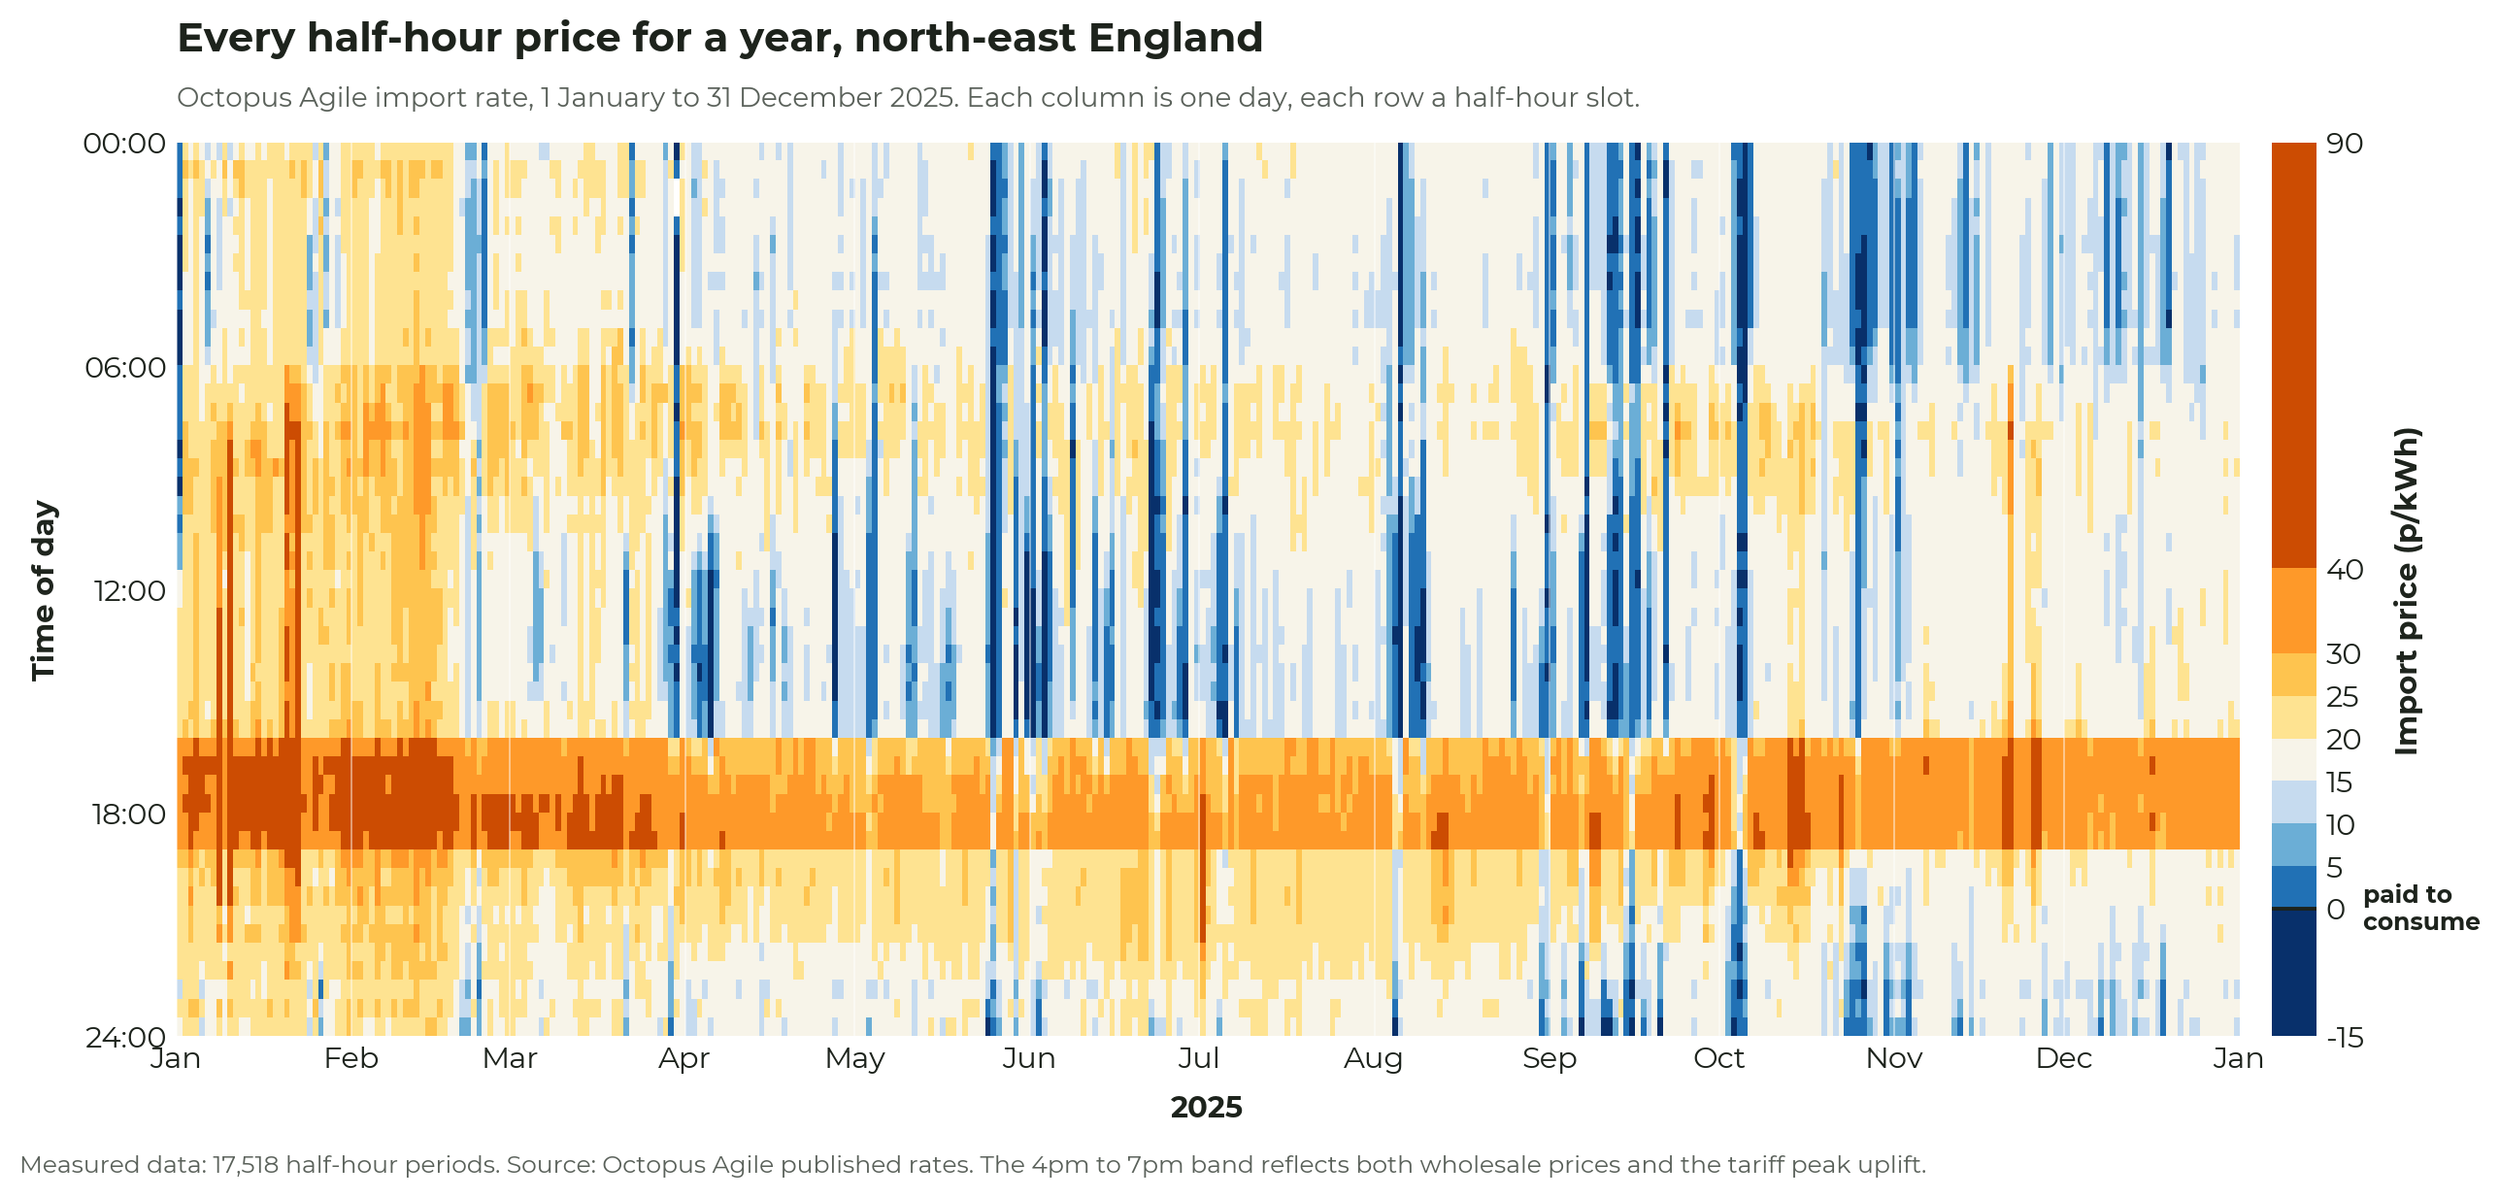
Across the year, the Agile import price was negative across a total of ~145 hours, or ~1.7% of all time slots, during which a household would’ve been paid to consume electricity. The cheapest single period was at three in the afternoon on 25 May 2025. The most expensive slots were January afternoons and evenings when the rate hit the Agile price cap of 100p/kWh several times. The key takeaway being that a unit of electricity in the same region varied by more than 108p/kWh across the year based on nothing but timing.
Two other patterns visible in the data:
Negative pricing is a daytime, warm-season phenomenon. The negative periods landed on just 38 days. Half of them fell between ten in the morning and four in the afternoon, and 90% fell between April and October. That indicates solar generation and lower summer demand are driving negative prices rather than surplus wind.
The cheapest slots in a day depend on the season. From March to September, the midday period was cheaper than the early hours of the morning on ~67% of the days. From October to February, that dropped to ~10%. For example, in June the midday average was ~4p/kWh below the overnight average, whilst in December it sat 5p/kWh above it. The cheapest period is not reliably at night for seven months of the year. It changes with the season, and within the season it depends on the weather.
The same year, measured in carbon
Great Britain's electricity averaged 127 gCO2eq/kWh across 2025. The cleanest half-hour of the year was 22 gCO2eq/kWh, at ten in the morning on 29 May. The dirtiest was 295 gCO2eq/kWh, at seven in the morning on 22 January. Between those two moments the carbon cost of running the same appliance varied by more than a factor of 13. By month, June was cleanest at 92 gCO2eq/kWh and January dirtiest at 168 gCO2eq/kWh.
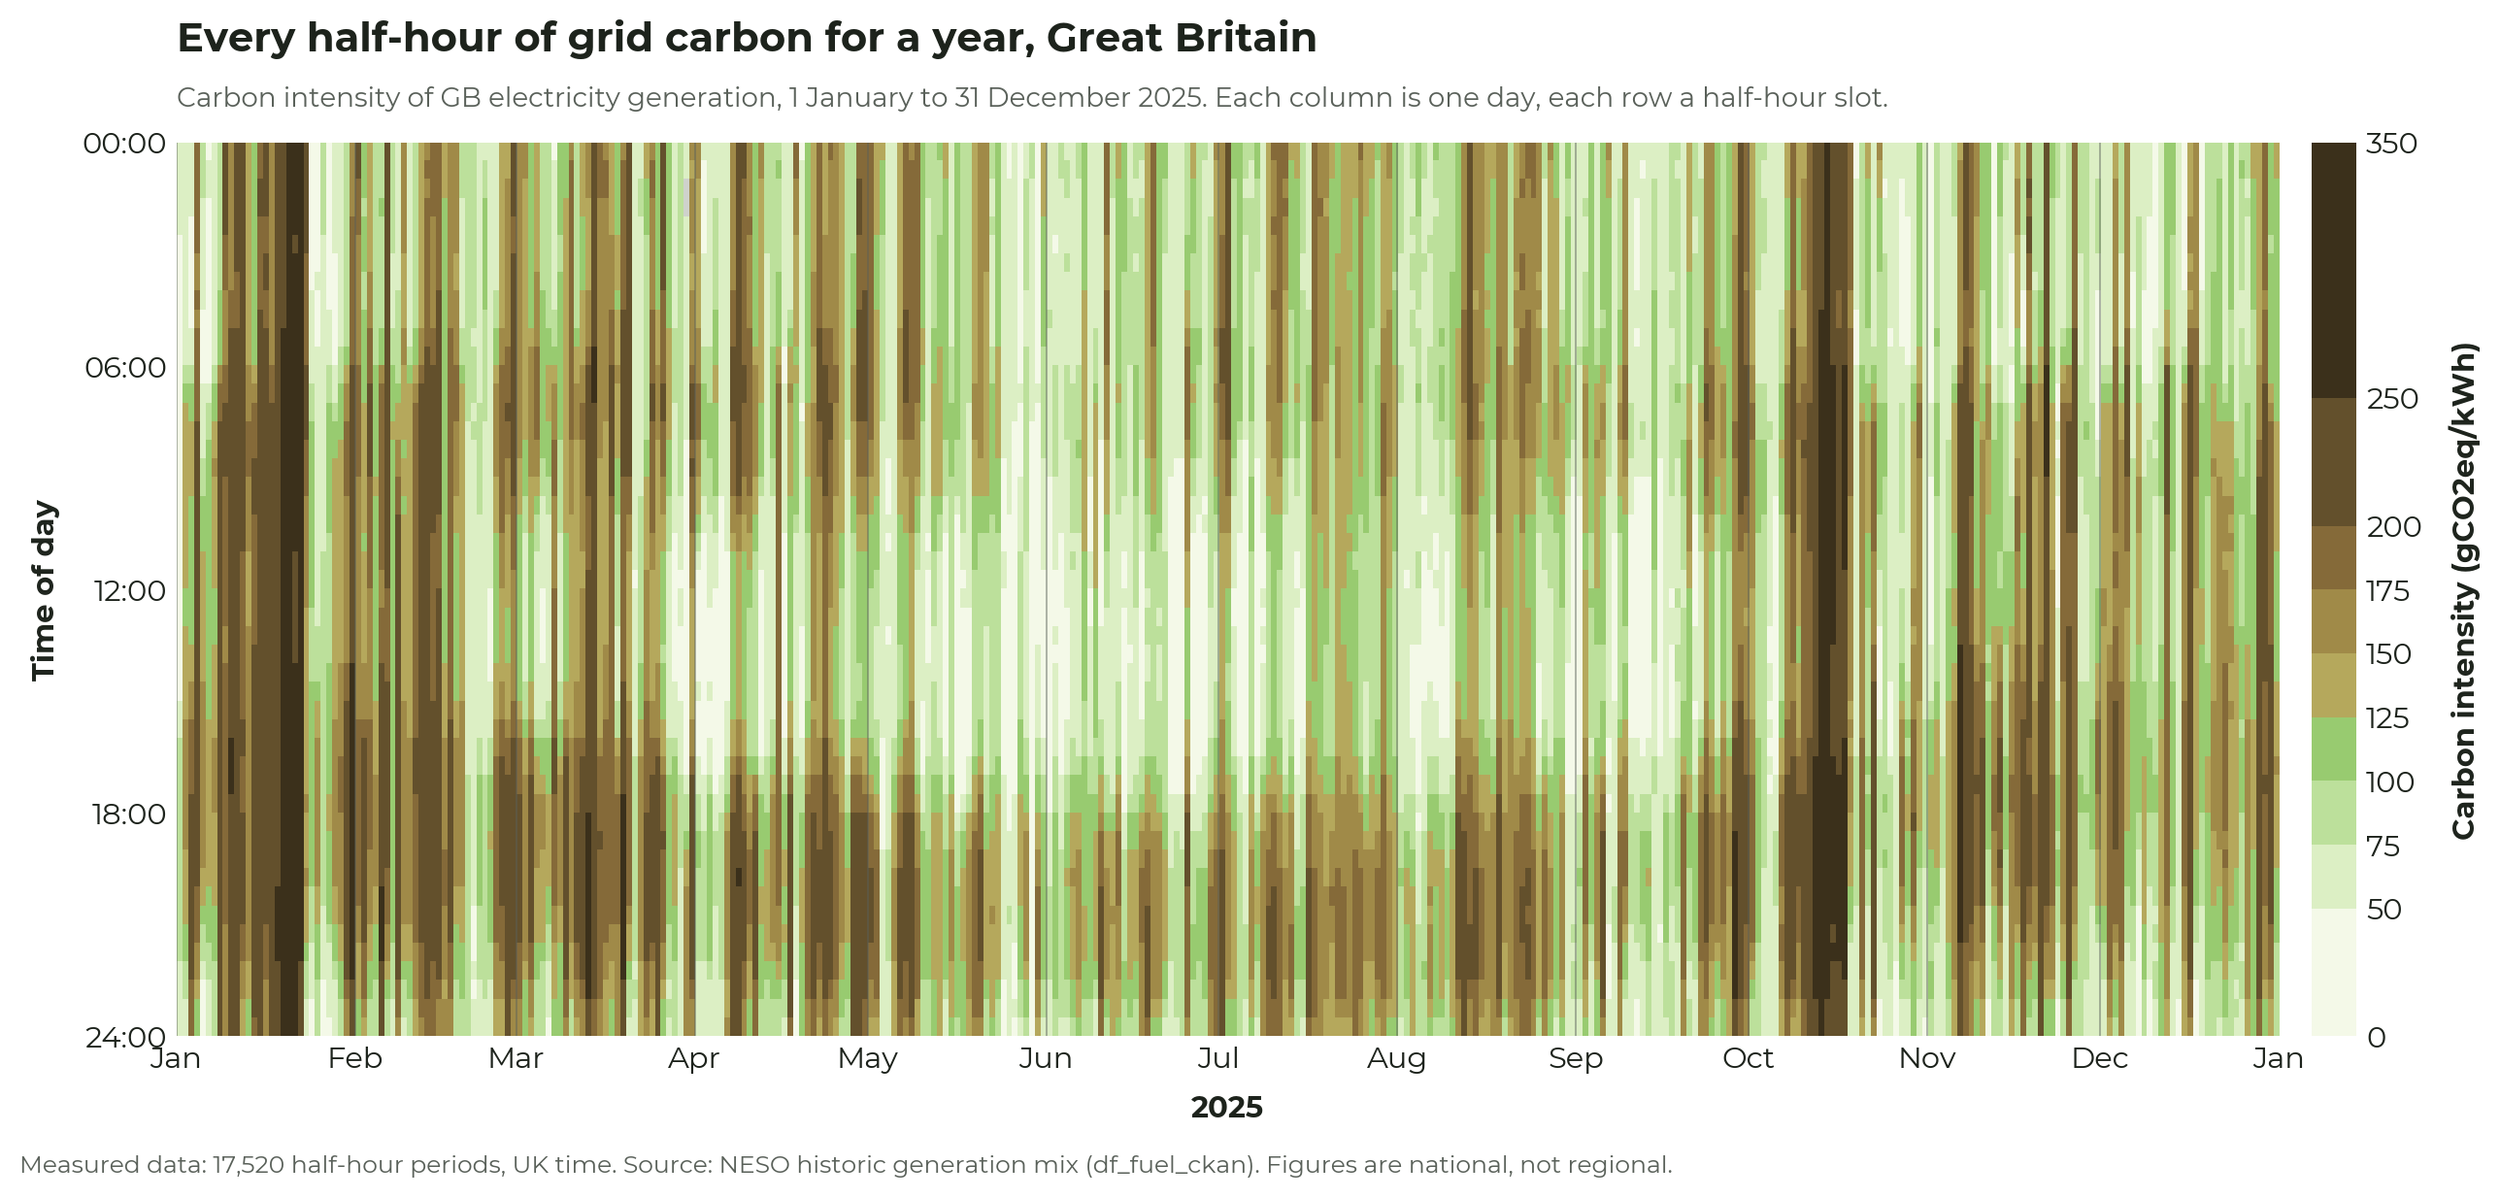
The time-of-day pattern mirrors the price pattern, and broadly for the same underlying reason. Averaged over the whole year, both the 11am to 4pm window and the early morning hours came in at ~110 gCO2eq/kWh, while the 4pm to 7pm evening peak ran at 144 gCO2eq/kWh. Split by season, the midday figure separates sharply: 86 gCO2eq/kWh from March to September against 149 gCO2eq/kWh from October to February. The same solar surplus that produced the negative price events also helps lower the carbon intensity of the grid.
A question for some people is whether buying cheap also means buying clean. Sorting all the 2025 data by price, we see that the cheapest fifth averaged ~60 gCO2eq/kWh and the dearest fifth averaged ~170 gCO2eq/kWh. Taking each day on its own terms, the ten cheapest half-hours (= 5hrs of charging time) of each day averaged ~100 gCO2eq/kWh against an overall daily average of ~130 gCO2eq/kWh.
A battery charging on price alone will land on cleaner-than-average electricity most of the time, but it will sometimes charge during a cheap half-hour that happens to be gas-heavy. Therefore, anyone wanting to optimise for carbon specifically needs to use daily carbon intensity prediction data, not pure prices. What the 2025 data supports clearly though is that shifting consumption away from the evening peak can reduce both the bill and the emissions behind it.
Note: The carbon figures are national, published by NESO for the whole of Great Britain, while the price data is the north-east Agile rate. The regional adjustment on Agile import prices is small, so the shape of the price curve is close to national.
What have households been paid for, and when?
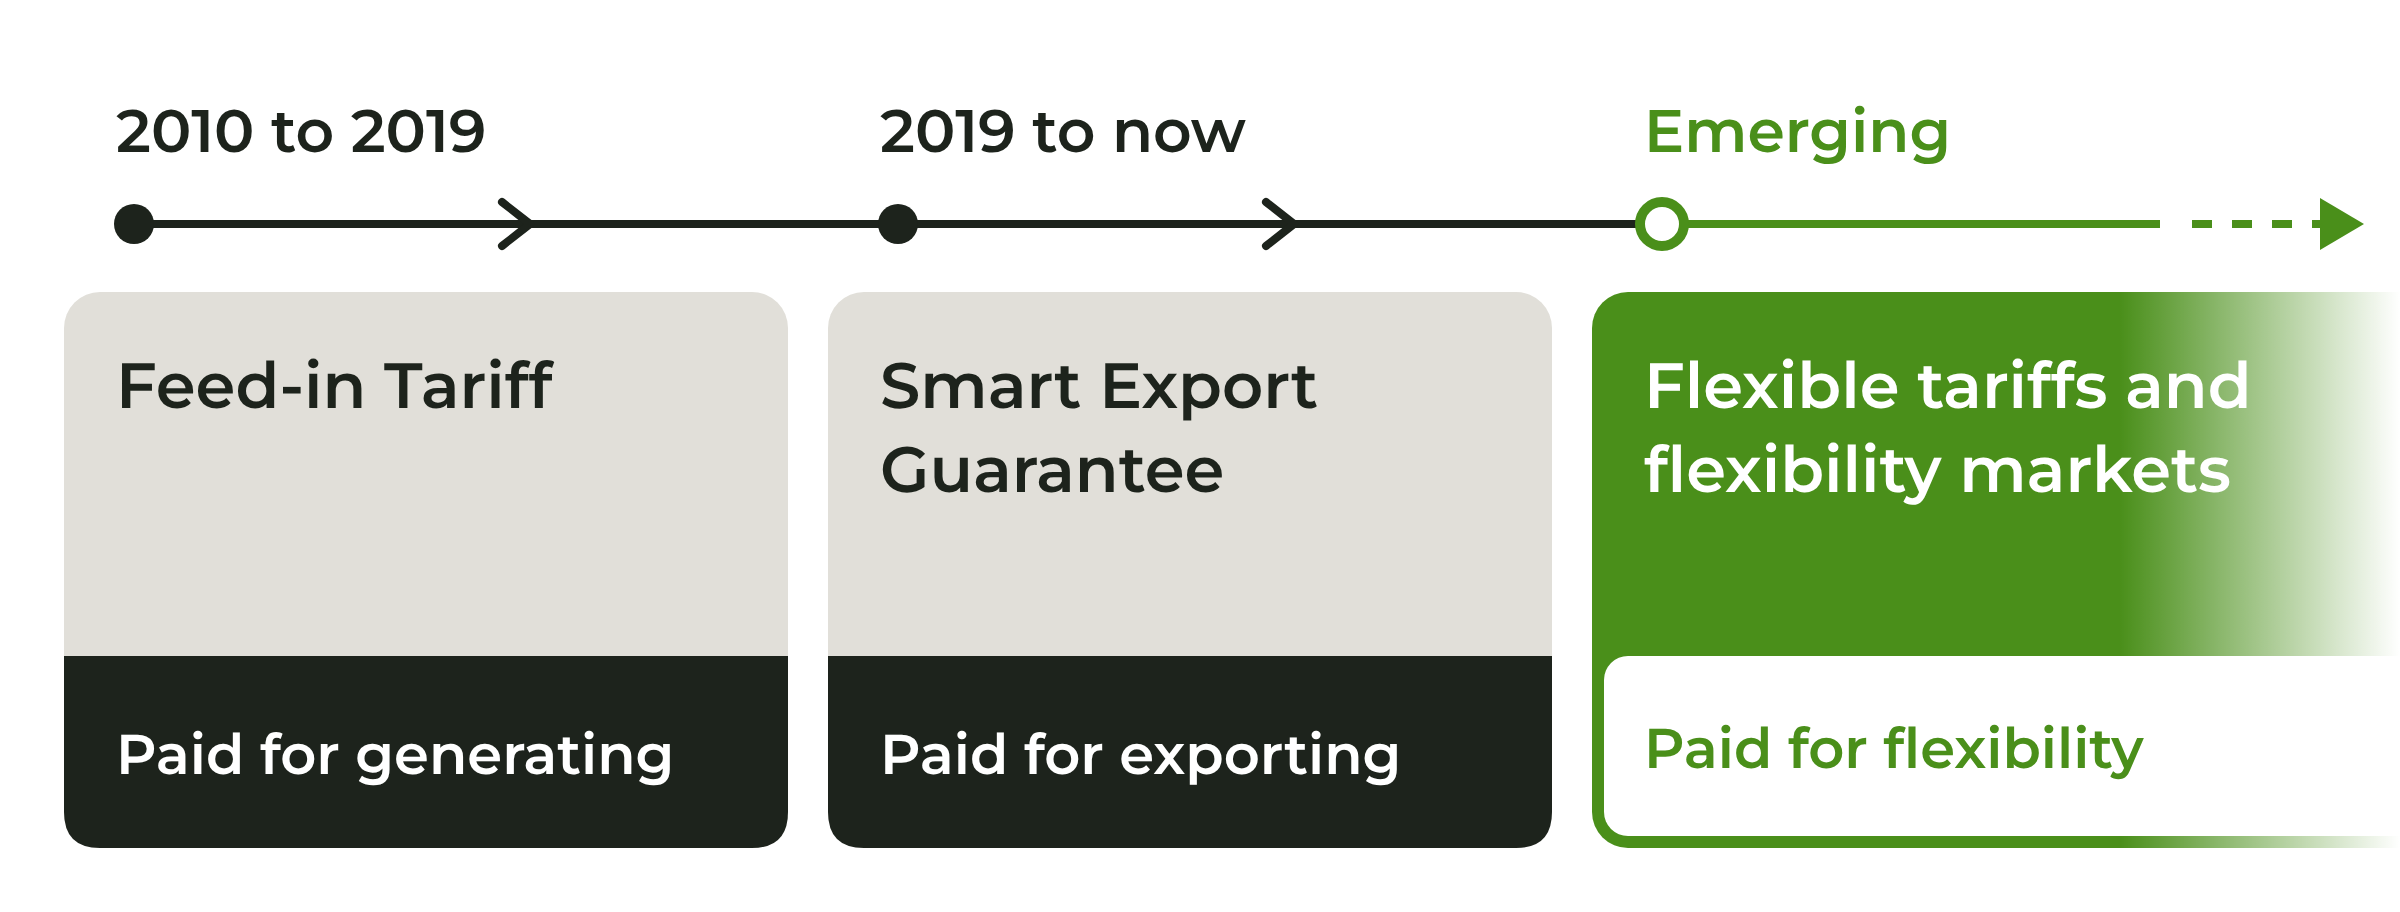
The way domestic generation has been rewarded tracks the energy transition and rollout of new technology. There have been three distinct periods, and each paid for something different.
Paid for generating: 2010 to 2019
The Feed-in Tariff scheme opened on 1 April 2010 with one goal: get early adopters to put solar panels onto their roofs. It paid households for every unit they generated, regardless of what happened to it afterwards, plus a smaller payment for any units exported.
The generation payment was the driver. Early rates reached around 43p/kWh, index-linked and guaranteed for 20 years. By the time the scheme closed to new applicants on 1 April 2019, Ofgem's annual report recorded around 850,000 accredited installations, over 95% of them domestic, with generation payments running at roughly £1.4 billion a year. The scheme successfully encouraged a substantial roll-out of rooftop solar and contributed to the massive decrease in cost for new panels that has happened over the last 20 years.
However, by design, timing was irrelevant: a unit generated at noon on a sunny bank holiday, when the grid was already awash with power, earned exactly the same as a unit generated on a dark January afternoon when the system was short of power. The scheme was built to add capacity, and it was blind to whether that capacity was useful at any given moment. In 2010, with very little solar generation on the system, that was a deliberate choice.
Paid for exporting: 2019 to now
The Smart Export Guarantee replaced the Feed-in Tariff for new installations. It differs in two significant ways.
Generation payments are gone so households are paid only for what they export, measured by a smart meter.
There is no subsidy behind the scheme. Licensed suppliers with more than 150,000 customers must offer an export tariff, but they can set the rate at any level above zero. What you receive is a commercial decision by your supplier, not a government-backed rate.
That has produced a wide and unstable spread. Rates ranged from roughly 3p/kWh to 25p/kWh in mid-2026 depending on supplier and eligibility conditions. Existing rates reflect what suppliers think exported power is worth to them, and for undifferentiated midday solar in an increasingly solar-rich system, that value is under pressure. For example, Octopus cut its flat Outgoing tariff from 15p/kWh to 12p/kWh on 1 March 2026.
Paid for flexibility: already beginning
Looking beyond the flat rates, something else is happening: the highest export payments available today are tied to specific hours. Octopus Intelligent Flux, for example, was paying up to ~30p/kWh for exports in the 4pm to 7pm window in mid-2026. The best rates typically require a battery, because without one you cannot control when you export or import.
Suppliers exposed to wholesale prices that fluctuate throughout the day have an incentive to price that difference. When the system is saturated with clean power, they can pay households to take some away whilst not paying anything to have more of it pushed on. When electricity is scarce, generation and stored energy are both valuable. When electricity is abundant, only the ability to absorb it has worth, and generating more adds to the problem. In either case having the flexibility to control when you import, use, or export power is increasingly valuable as more renewables are connected to the grid and suppliers are starting to reward customers directly.
Where policy is heading
Policy is also moving the same direction. In July 2025, the Department for Energy Security and Net Zero, Ofgem and NESO jointly published the Clean Flexibility Roadmap, the first unified government strategy aimed at flexibility rather than generation, with a progress update in July 2026. Based on NESO scenario modelling, the Roadmap anticipates an eight-fold increase in clean flexibility capacity between 2024 and 2050. A Flexibility Commissioner was appointed in December 2025 to drive delivery across departments.
Several features matter directly to domestic customers:
Half-hourly settlement. Time-of-use tariffs, which charge different rates at different times of day, only work if the system can measure consumption in half-hour blocks and settle suppliers accordingly. That migration is well advanced and mid-June 2026 around a third of Britain's electricity metering systems had made the switch. All meters are due to migrate by May 2027. This is the technology that makes everything else possible.
Removing levies from stored electricity. Electricity that is imported, stored and later exported has had environmental and social levies applied to it as though it were consumed once. Government has committed to take primary legislative powers to remove final consumption levies for demand turn up, stating that this will boost the commercial case for bidirectional electric vehicle chargers and domestic batteries.
Paying people to use surplus power. In March 2026, the Department for Energy Security and Net Zero and UK Research and Innovation announced a trial of up to £20 million testing whether removing those levies would encourage households and businesses to increase consumption during transmission-constrained periods. It starts in winter 2026 and runs across two winters. The stated ambition is that consumers could use otherwise wasted wind energy at lower cost, or even free.
Flexibility as a property attribute. Energy Performance Certificates are being reformed to include a Smart Readiness metric, measuring a home's ability to generate energy, optimise consumption and manage energy flexibly. It launches in the second half of 2027 and feeds into minimum standards for rented properties from October 2030.
Flexible tariffs as the default. Government has committed to assess whether households receiving support for low carbon technologies should access it on a flexible tariff, with an opt-out, setting out plans by early 2027. Ofgem is separately considering how the price cap should accommodate time-of-use tariffs as they become mainstream.
All of these policies reward households that can shift when they use electricity, and highlight the shift away from a system that treats all kilowatt-hours as interchangeable.
Where this leaves a home with a battery
The Feed-in Tariff rewarded generation. The Smart Export Guarantee rewards export. The emerging framework rewards the ability to move consumption in time, and a battery system does that whether or not there are solar panels installed. It charges when the system has surplus and prices are low, then supplies the home when the system is tight and prices are high, every day, without anyone needing to change their routine.
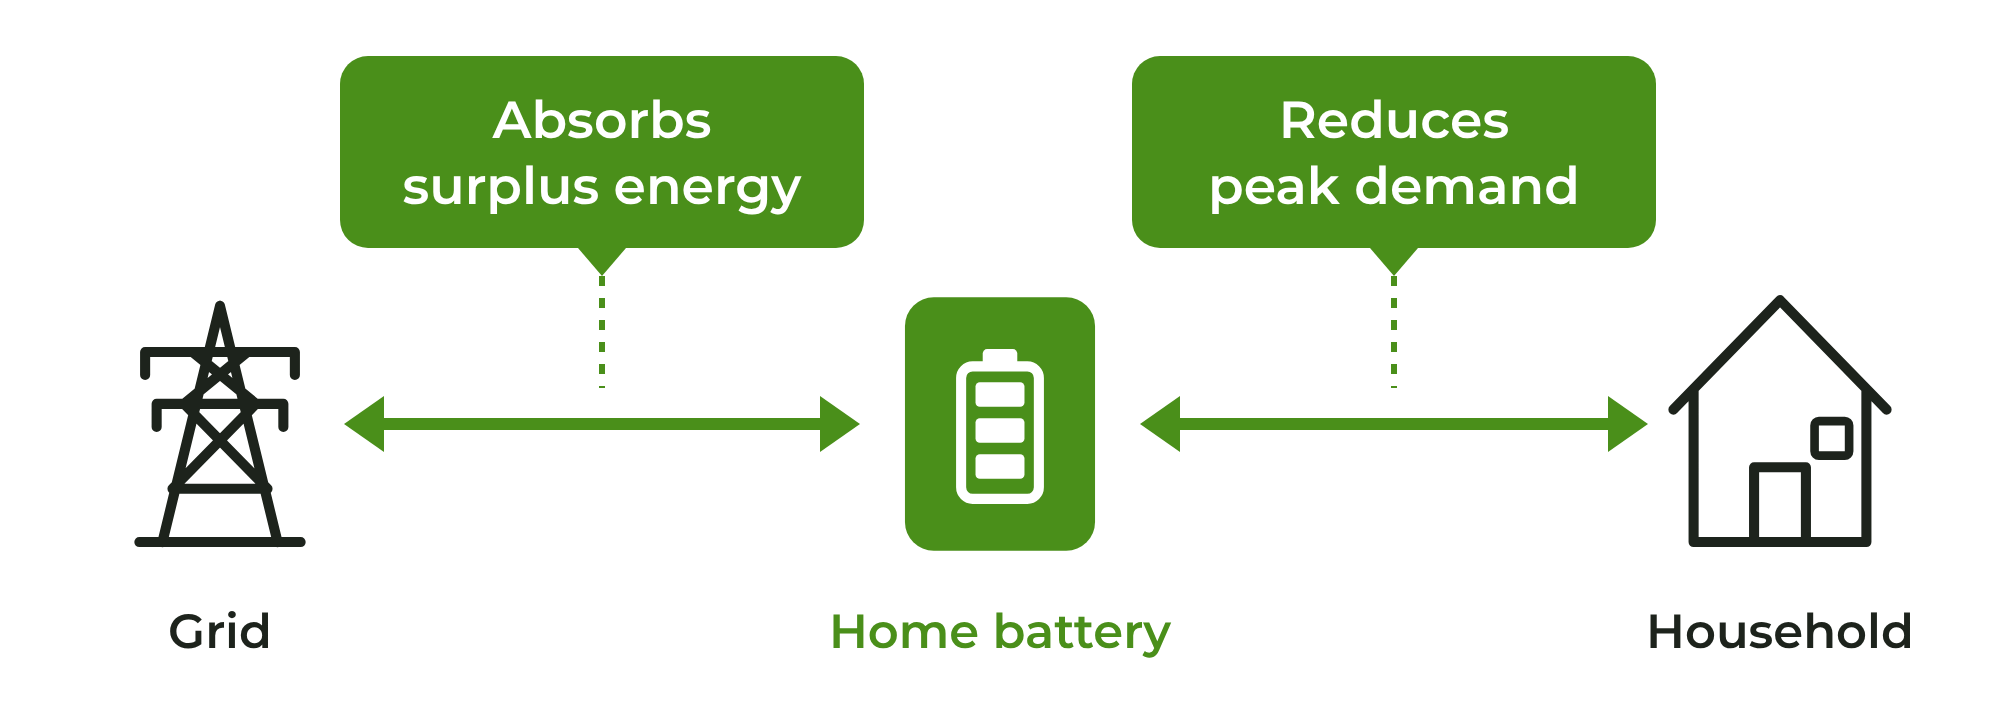
In flexibility terms, a home battery is a connected asset that can both absorb excess grid energy and reduce consumption on demand. Those are the two capabilities the grid is short of and they will remain valuable as more renewables come online.
References
DESNZ, Ofgem and NESO. Clean Flexibility Roadmap, July 2025
DESNZ, Ofgem and NESO. Clean Flexibility Roadmap: July 2026 update, July 2026
Ofgem. Feed-in Tariffs (FIT)
Ofgem. Feed-in Tariff Annual Report 2018-19, December 2019
Modo Energy. Constraints in Great Britain: Scottish wind curtailment and what it means for battery storage, March 2026
EquiVolt analysis of Octopus Agile half-hourly import and export rates, north-east England, 1 January to 31 December 2025. Measured data, half-hour periods
NESO. Historic generation mix and carbon intensity, 1 January to 31 December 2025. Measured data, 17,520 half-hour periods, converted from UTC to UK local time